
|
Jun 2020,Volume 42, No.2
|
Update Article
|
Methodology and statistics for clinical research – Part 2: comparison between 2 variablesStanley CN Ha 夏正楠 HK Pract 2020;42:45-48 SummaryWhen we want to do a statistical test / hypothesis test, we first of all will need to formulate a null hypothesis and an alternative hypothesis based on the research question. Then, we need to choose an appropriate statistical test to accept or reject the null hypothesis. Finally, we can then draw a conclusion to the research question based on the results. After reading this article, you should know now how to set a hypothesis and when to use which statistical test for different types of variables. 摘要在進行統計檢驗和假設檢測時,我們先需要按研究課題設 置虛無假設和備擇假設。然後選用適當的統計分析推斷虛 無假設是否成立。最後,將研究結果作出結論。本文有助 了解如何制定「假設」及為不同類型的變項選擇適合的統 計檢驗方式。 IntroductionIn our first article, we mentioned about the type of data and the two basic concepts of statistics: normal distribution and central limit theorem. 1 In this article, we will talk about simple statistical tests between 2 variables. To do a statistical test, you first formulate a hypothesis based on the research question you have formulated for your research. After recruiting enough samples, you then select appropriate statistical tests to analyse the data and finally draw a conclusion generalising to a larger population. Data can be classified as categorical or continuous, dependent or independent variables. We choose an appropriate statistical test by considering the combination of the variables. Formulating a hypothesis 2Hypothesis is a simple statement for interpreting the result of a statistical test. Statistical test (hypothesis testing) involves 2 mutually exclusive and exhaustive hypotheses, null hypothesis (Ho), and alterative hypothesis (H1). For example: Ho : µ1=µ2 H1 : µ1≠µ2 The null hypothesis states that the two population whose means are equal. Notice that the two hypotheses are mutually exclusive (cannot happen both ways) and exhaustive (there is no possible third alternative). In the example hypotheses presented, the two comparison groups are either equal to each other or statistically different. We will only accept 1 of the 2 hypotheses by considering a p-value which is a probability that we wrongly reject the null hypothesis (also called type I error or alpha). The cutoff of p-value, which we usually use to reject the null hypothesis is 0.05. In other words, if the p-value is less than 0.05 from a statistical test, we will reject the null hypothesis and conclude we accept alterative hypothesis. Sometimes, in a more stringent research, a lower cutoff of p-value can be considered, like 0.01. We need to bear in mind that even if we have concluded to accept alterative hypothesis, there is still a small probability that the null hypothesis is wrongly rejected. In theory, the same research repeated 100 times (if the null hypothesis is actually true) there are still less than 5 times where we may draw a conclusion rejecting the null hypothesis. Parametric vs Non-parametric testsParametric tests are statistical tests that, when the data needs to meet some assumptions depending on which statistical test is chosen. Non-parametric tests are also called distribution-free tests because the data does not follow a specific distribution. We usually use non-parametric tests when the data do not need to meet the assumptions of the parametric tests, especially the assumption is about normally distributed data. Details on choosing parametric or non-parametric test can be referred to the suggested reading below. Table 1 shows some examples of parametric tests and non-parametric tests in different combination of variables. 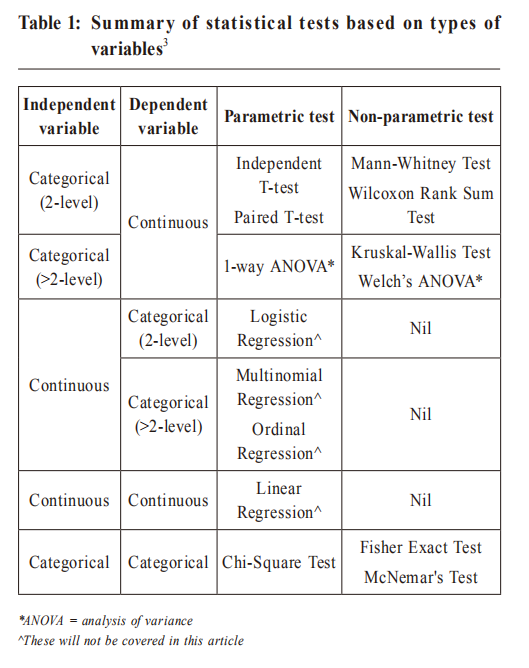 Testing one categorical independent variable (2-level) and one continuous dependent variableHypothesis for paired t-test, independent t-test, Wilcoxon Rank Sum test and Mann-Whitney testHo : µ1=µ2 vs H1 : µ1≠µ2 It is common in clinical study to do a hypothesis testing on a continuous variable with a 2-level categorical variable, such as, testing whether pain scores are different between two groups of patients using two different drugs. The two levels in the categorical variable can be related to each other (for example, pre-treatment and post-treatment) or not related to each other (for example, drug A and drug B). If the two levels in the categorical variable are related to each, paired t-test is used. Otherwise, independent t-test is used. There are assumptions when applying the parametric tests, paired t-test and independent t-test. If the assumptions are not met, non-parametric tests, Wilcoxon Rank Sum test and Mann-Whitney test should be used instead. The assumptions are summarised in the following:
For the first assumption, we can make use of statistical test of Shapiro-Wilk test to see if the data is normally distributed or not. But most of the time, a histogram with a bell shape is enough to show the data is normally distributed. If the histogram or the Shapiro-Wilk test shows the sample is not normally distributed, we fortunately can still make use of Central Limit Theorem mentioned in Part 1 of this article series to conclude that the sample mean is still approximately normally distributed provided that the sample is large enough (sample size >25). In simple words, if the sample size is small and the data does not look like a bell shape, a non-parametric test is suggested for data analysis. For the second assumption, we can make use of Levene’s test to see if variances from two or more samples are equal or not. If Levene’s test shows the variances from two samples are not equal but the number of sample in two samples are similar, an independent t-test without the assumption of equal variance, called Satterthwaite approximate t-test, should be used. Otherwise, a non-parametric test is suggested for use. Hypothesis for Levene’s testHo : σ12=σ22=. . .=σk2 vs H1: Variances are not all equal For non-parametric tests, Mann-W hitney test (also called Wilcoxon test) is used for two independent samples and Wilcoxon Rank sum Test (also called signed rank test) is used for two paired samples if the data does not meet the above two assumptions. If a wrong test is selected, for example, using non-parametric test for normally disturbed data, the power of the hypothesis testing would be reduced. This means the probability that the test correctly rejects the null hypothesis is reduced. Testing one categorical independent variable (>2-level) and one continuous dependent variableHypothesis for 1-way ANOVA, Welch’s ANOVA and Kruskal-Wallis testHo: µ1=µ2=. . .=µk vs H1 : Means are not all equal It is also common in clinical study to do a hypothesis testing on a continuous variable with a >2-level categorical variable, such as testing if pain scores are different between three groups of patients using three different drugs. The three levels or more in the categorical variable can be related to each other (for example, pre-treatment, 1 month post-treatment and 6 months post-treatment) or not related to each other (for example, drug A, drug B and drug C). If the three levels or more in the categorical variable are related to each other, it usually refers to longitudinal study and the statistical analysis on this type of data will not be covered in this article. If the three levels or more in the categorical variable are not related to each other, 1-way analysis of variance (1-way ANOVA) is used. There are assumptions in using parametric test and 1-way ANOVA. If the assumptions are not met, non-parametric tests, such as Kruskal-Wallis test or Welch’s ANOVA, should be used instead. The assumptions are summarised in the following:
For the first and second assumptions, you can refer to the methods mentioned in “Testing one categorical independent variable (2-level) and one continuous dependent variable”. For the third assumption, in simple words, if your samples in each level of category are not from the same group of participants (not a longitudinal study), it means your data can fulfill this assumption. For 1-way ANOVA, we are testing a hypothesis that the means from each level of the categorical variable are the same. If the result is significant, further multiple comparisons can be applied to assess the significance between different levels. We could use Bonferroni’s method, Scheffe’s method or Tukey’s method to adjust the value of significance, however, the details will not be covered in this article. If the samples are similar in each level of the categorical variable, Scheffe’s method is recommended. If the samples are not similar in each level of the categorical variable, Tukey’s method is recommended. Bonferroni’s method could be used if there is no preference on either methods. If only assumption 2 is violated, Welch’s ANOVA is suggested. Otherwise, Kruskal-Wallis test is suggested. When using ANOVA, we have to be careful of the outliers i.e. an observation point far away from the others, which has a large impact on the ANOVA results. Therefore, outlier cases are usually excluded. Details on outlier scan be referred to the suggested reading list below. Testing two categorical variablesHypothesis for Chi-square test, Fisher's exact test and McNemar's testHo : p1=p2=. . .=pk vs H1 : Proportions are not all equal It is common in epidemiology study to do a hypothesis testing on categorical variables, such as testing if cardiovascular disease will decrease more after taking drug A comparing with drug B. The categorical variables can be related to each other (for example, severe illness at age 12 and age 14 from the same group of participants) or not related to each other (for example, cardiovascular disease and different drug in different groups of participants). If the categorical variables are not related to each other, Chi-square test is used. There are assumptions in using parametric tests and Chi-square test. If the assumptions are not met, non-parametric tests, Fisher's exact test or McNemar's test, should be used. The assumptions are summarised two in the following:
For the first assumption, enough sample size is required for using Chi-square test. If the sample size is too small, Fisher’s exact test (non-parametric test) should be considered. For example, in a 2x2 table, if an expected value in one of the cells less than 5, Fisher's exact test is suggested. Details on the sample size requirement for Chi-square test and exact test can be referred to the suggested reading list below. 
For the second assumption, if the categorical variable are related to each other, for example data in pre and post from the same group of patients, McNemar's test (non-parametric test), should be considered. Details on McNemar's test can be referred to the suggested reading list below. Most of the time , Fisher's exact test and McNemar's test are used for 2x2 table. If other sizes of table (2x k table, where k≥3) are needed for the analysis, interpretation of the results should be very careful since there are no further multiple comparisons between different levels can be done like ANOVA above. Therefore, significant results can only conclude at least two of the proportions are different. If both of the categorical variables have more than two levels (a x b table, where a≥3 and b≥3), the hypothesis is not the proportion but the dependence of the two categorical variables. For example, if the result is significant in testing between level of physical exercise and level of blood pressure, you can only conclude the level of blood pressure does not depend on the level of physical exercise. If the focus of the analysis is on the proportion and you have more than 2 levels in a categorical variable, you can try to group them into 2 levels only. ConclusionTo answer are search question , it is always important to set a hypothesis before doing the analysis. Once an appropriate hypothesis is set, a statistical test can be decided to answer the hypothesis. If assumptions of a parametric test are not met, a non-parametric test should be considered. Finally, you can then draw a conclusion to your research question. Further reading suggestions
Stanley CN Ha, BSc (Statistics), MPH
Correspondence to:Mr Stanley CN Ha, Primary Healthcare Office, Unit 1505-1506,
15/F, THE HUB, 23 Yip Kan Street, Wong Chuk Hang, Hong
Kong SAR.
References:
|
|