September 2008, Vol 30, No. 3 |
Original Articles
|
||||||||||||||||||||||||||||||||||||||||||||||||||||||||||||||||||||||||||||||||||||||||||||||||||||||||||||||||||||||||||||||||||||||||||||||||||||||||||||||||||||||||||||||||||||||||||||||||||||||||||||||||||||||||||||||||||||||||||||||||||||||||||||||||||||||||||||||||||||||||||||||||||||||||||||||||||||||||||||||||||||||||||||||||||||||||||||||||||||||||||||||||||||||||||||||||||||||||||||||||||||||||||||||||||||||||||||||||||||||||||||||||||||||||||||||||||||||||||||||||||||||||||||||||||||||||||||||||||||||||||||||||||||||||||||||||||||||||||||||||||||||||||||||||||||||||||||||||||||||||||||||||||||||||||||||||||||||||||||||||||||||||||||||||||||||||||||||||||||||||||||||||||||||||||||||||||||||||||||||||||||||||||||||
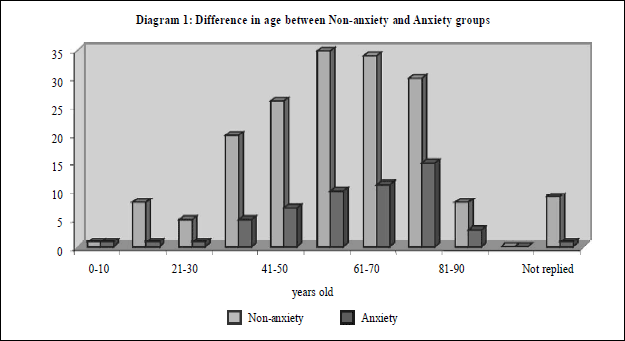
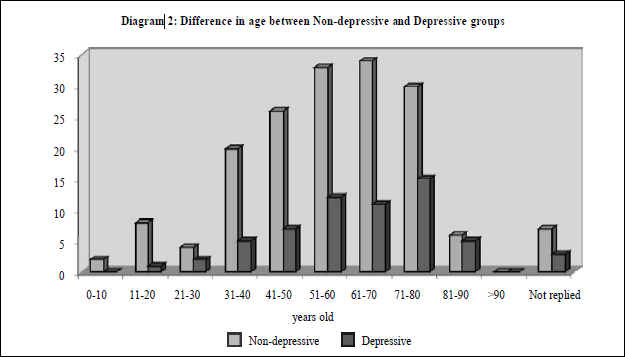
Prevalence of depressive and anxiety symptoms and their correlates in the Central and West Districts of Hong Kong IslandMaria K W Leung 梁堃華, Alfred Kwong 鄺兆基, Charles Ngai 魏家豪, Jenny Wang 王華力, Emily Tse 謝翠怡, Stephen Chou 周俊永, Wendy W S Tsui 徐詠詩, Daniel W S Chu 朱偉星 HK Pract 2008;30:115-127 Summary Objective: To analyse 1) the prevalence of depressive and anxiety symptoms among the population in the Central and West Districts of Hong Kong Island, 2) the association between these symptoms and their correlates. Design: A cross-sectional questionnaire survey. Subjects: Subjects who attended the booth set up by the author at the Hong Kong Central and West Health Festival held on 26-27th September 2007 were asked to complete the Hospital Anxiety and Depression Scale (Chinese version) (HADS) questionnaires. Main outcome measures: 1) prevalence of depressive and anxiety symptoms among the people in the Central and West Districts of Hong Kong Island; 2) odds ratio was used to assess the association between symptoms of depression and anxiety and their correlates. Results: 239 subjects who attended the author's booth in the Central and West Health Festival held on 26-27th September 2007 completed the questionnaires. 176 subjects had HADS-A score<8 while 55 had HADS-A score >8. 170 subjects had HADS-D score 8. Those with a household income >$10000 were significantly less likely to have HADS-D score >8 (OR 0.27 [CI 0.09-0.80]). Those with primary or higher education level was significantly less likely to have HADS-A score >8 (OR 0.1 [CI 0.02 -0.49]) whereas those with two or more chronic illnesses were significantly more likely to have HADS-A score>8 (OR 12.99 [CI 1.35-125]). Conclusion: Household income, education level, and number of chronic illnesses have been found to be significantly associated with symptoms of depression and anxiety. As family doctors are often the first point of contact, we should be more watchful when dealing with these groups of patients in order to detect their symptoms early and to provide anticipatory care appropriately. Keywords: Depression, Anxiety, Prevalence, Correlates, Household income, Education level, Chronic illness 摘要 目的:分析1)香港島中區和西區人口中抑鬱和焦慮症狀的流行狀況;2)症狀之間的相互關聯。 設計:橫斷面問卷調查。 對象:2007年9月26-27日參加香港中區和西區健康節,光臨作者展臺並被邀請填寫問卷的人仕。 主要測量內容:1) 香港島中區和西區人口中抑鬱和焦慮症狀的流行狀況;2)利用比值比例來評估抑鬱和焦慮症狀之間的相互關聯。 結果:2007年9月26-27日舉辦的香港中區和西區健康節,共有239人光臨作者展臺並且填寫了問卷。176人的 HADS-A 得分8。170人 HADS-D 得分8。家庭收入高於 10000港幣者 HADS-D 得分明顯更不容易>8 (OR 0.27 [CI 0.09-0.80])。接受小學或以上教育者的HADS-A得分明顯更不容易>8 (OR 0.1 [CI 0.02 -0.49])。患有2種或以上慢性病者的 HADS-A 得分明顯地更容易>8 (OR 12.99 [CI 1.35-125])。 結論:我們發現家庭收入、教育水平和慢性病的數量與抑鬱及焦慮症狀顯著相關。由于家庭醫生常常是病人的首診醫生,處理此類病人時,我們應該更加小心,以便能早期發現其症狀,並提供正確的預防服務。 主要詞彙:抑鬱,焦慮,流行狀況,相互關聯,家庭收入,教育水平,慢性病 Introduction According to World Health Organisation, mental illness currently ranks fourth in contributing to global disease burden, but it is predicted to outrank stroke and cancer in the future.1,2 In Hong Kong, two separate surveys showed that 60-70% of the population is affected to some degree.1 Among all mental illnesses, depression and anxiety are the two commonly encountered conditions in primary care which often lead to extensive utilization of the health service.3 These two mental conditions often have a chronic effect on an individual's life with marked disability and morbidity.4,5 However, despite these being two major health care problems, both depression and anxiety are often not recognized by patients themselves or by their doctors.6-9 In order to reduce the impact of these mental illnesses on our health, early identification and treatment are essential. In the Goldberg and Huxley's model (1980), patients themselves act on the first level while their doctors act on the second level of filtering in recognizing patients with psychiatric morbidity. In order to help to strengthen this filtering system, a strong awareness of depression and anxiety disorders among family doctors should be raised. Before trying to educate ourselves on how to improve detection of these disorders, it would be important for us to understand the background of these depressive and anxiety patients. Therefore, this study has two main objectives: 1) to determine the prevalence of depressive and anxiety symptoms among the people living around the author's clinic, i.e. Central and West districts of Hong Kong; and 2) to analyse the associations between demographic factors and these two symptoms. Method This questionnaire survey was carried out at the Hong Kong Central and West Health Festival held on 26-27th September 2007. Study design The questionnaire design (Appendix 1) included two parts: 1) Demographic data including age, sex, marital status, education level, living status, household income, and number of co-existing chronic illness; 2) the Hospital Anxiety and Depression Scale (HADS). The HADS was chosen because it is a sensitive tool and is a validated scale10,11 used in a primary care setting worldwide to assess anxiety and depressive symptoms. The Chinese version of the HADS had been shown to have good reliability and validity.12,13 A study in 1995 had validated the Chinese version of the HADS and the sensitivity was 79% and specificity was 80%.14 It is also independent of the subject's educational level and is simple to use.14 Approval for using the Chinese version of the HADS has been obtained from the GL Assessment, UK. Patient selection The Hong Kong Central and West Health Festival is a yearly function supported by the Hospital Authority and non-government organizations for promoting health for the public in the Hong Kong's Central and West Districts. In 2007, the Festival was held on 26 to 27th September and had attracted more than 500 people. The theme of our booth was to promote mental health. All subjects who attended our booth, which was manned by the staff of the author's clinic, was each given the questionnaire to fill out. These were immediately collected by staff upon completion. The minimum sample size required, based on a 95% confidence interval with a 6% error,15 was calculated to be 224. Outcome measures and statistical methods HADS consists of 14 items, 7 for anxiety (HADS-A) and 7 for depression (HADS-D). Each item is rated from 0 to 3, and the sum score range on the HADS-A and HADS-D, therefore, is from 0 to 21. Based on an accepted cutoff level on HADS16 four groups were defined in this study: Non-anxious group (Group NA: HADS-A <8); Anxious group (Group A: HADS-A >8), Non-depressive group (Group ND: HADS-D <8); and Depressive group (Group D: HADS-D >8). Data were translated into numerical values and analysed with SPSS v13. Chi square test was used to analyse the difference in demographic characteristics between Group NA and Group A or Group ND and Group D. Multinomial logistic regression was used to identify the relationship between Groups NA and A or Groups ND and D with the independent predictors, namely age, sex, marital status, education level, living status, household income, and number of co-existing chronic illness. P<0.05 was considered to be statistically significant. Results General findings In total, 239 questionnaires were collected but 8 of the questionnaires were excluded due to failure to complete the Hospital Anxiety and Depression Scale. 176 (76.2%) had HADS-A score <8 while 55 (23.8%) had HADS-A score >8. 170 (73.4%) had HADS-D score <8 whereas 61 (26.6%) had HAD-D scores >8. 140 (60.6%) were female and 38 (16.5%) were male, whereas 53 (22.9%) did not write down their sex. 120 people were > 60 years old while 101 were below 60 years old and 10 people did not reply (Please see diagram 1 for details in age distribution).
Non-Depressive Group (Group ND: HADS-D score <8) vs Depressive Group (Group D: HADS-D score >8) A higher proportion of subjects in Group D (44.3%) had household income &$10000 when compared to the Group ND (32.9%). There was significant difference in this characteristic between Group ND and Group D. Households with income >$10000 were significantly less likely to have symptoms of depression (OR 0.27, CI 0.09-0.8, p <0.05). However, there was no significant difference in age, sex, education level, marital status, living status, and number of chronic illnesses between Group ND and Group D (Table 1).
Non-Anxiety Group (Group NA: HADS-A score <8) vs Anxiety Group (Group A: HADS-A score >8) There were more subjects in Group A (27.3%) with education lower than primary level than in the Group NA (14.8%). Education of primary school or above was significantly less likely to have symptoms of anxiety (OR 0.1, CI 0.02-0.49, p <0.05). More subjects in Group A had two or more chronic illnesses (14.5%) than subjects in the Group NA (1.7%). It was found that having two or more chronic illnesses was more likely to have symptoms of anxiety (OR 12.99, CI 1.35-125, p <0.05). However, there was no significant difference in age, sex, marital status, living status, and household income between Group NA and Group A (Table 2).
Discussion Prevalence of anxiety symptoms Anxiety disorders remain prevalent throughout ages 18 to 64.17 Our study has found a high proportion of subjects (23.8%) were with anxiety symptoms. In fact, a review paper in 2006 had shown that the pooled 1-year and lifetime prevalence for total anxiety disorders were 10.6% and 16.6%.17 A local paper in 1993 had found that the prevalence for men and women were 7.8% and 11.1%, respectively.18 Further studies to include data from Kowloon, New Territories, and other districts in Hong Kong would be more representative on the prevalence of anxiety symptoms. Prevalence of depressive symptoms In our study, one in four subjects (26.6%) was found to have depressive symptoms and the prevalence in those older than 60 years-old was even slightly higher (31%). The results were comparable to overseas studies,19,20 which had revealed that depressive symptoms were experienced in one-third of elderly in Australia, America, and Europe. These were also comparable to the results from a local study in which the 15-item Geriatric Depression Scale was used and found a prevalence of depression of 29.2% and 41.1% for older men and women, respectively.21 As many local studies on prevalence of depressive symptoms were carried out in the elderly population, it would be worth launching studies on the prevalence in the society as a whole. Association between depressive & anxiety symptoms and their correlates We identified three factors that were significantly associated with symptoms of depression and anxiety. Firstly, those with a household income >$10000 were less likely to have symptoms of depression. This was consistent with the findings from a local paper where financial strain was positively associated with depression among the elderly in Hong Kong.22 Financial strain may not only affect mental health, but it could also be harmful on physical health. One recent study found that financial strain was significantly related to the number of somatic complaints, physical illnesses reported, functional capacity, and self rated health among Chinese older adults in Hong Kong.22 Secondly, those with at least primary education level were less likely to have symptoms of anxiety. Higher education level could imply better understanding of one's problems and hence better management skills. This could reduce the propensity for getting worried and anxious. Thirdly, people with two or more chronic illnesses were more likely to have symptoms of anxiety. Although similar local data on anxiety and its correlates were lacking, some overseas studies had found that people with chronic pain24 or dermatological problems25 were more likely to have anxiety symptoms. A meta-analytic review of the literature had also suggested that anxiety disorders were associated with poor glycaemic control in diabetic patients.26 In this study, the association of the number of chronic illnesses with depression was not significant, while a local study on the elderly Hong Kong population found that depression prevalence rose markedly with the number of chronic medical conditions.27 Further work on the relationship between the prevalence of depression and type as well as severity of chronic medical conditions may help to elaborate the situation. Age, gender, marital status, and living status had not been found to be closely associated with these symptoms. This was comparable with the results from a local study.22 Limitation The main limitations in this study were the small sample size and lack of generalisability as only subjects who attended the Hong Kong Central and West Health Festival were involved. Conclusion Household income, education level, and number of chronic illnesses have been found to be significantly associated with symptoms of depression and anxiety. As family doctors are often the first point of contact, we should be more watchful when dealing with these groups of patients in order to detect their symptoms early and to provide anticipatory care appropriately. Key messages
Maria K W Leung, DipOM, FHKCFP, FRACGP, FHKAM (Family Medicine) Alfred Kwong, FHKCFP, FRACGP Charles Ngai, FHKCFP, FRACGP Jenny Wang, FHKCFP, FRACGP Emily Tse, FHKCFP, FRACGP Stephen Chou, MBBS Wendy W S Tsui, DipOM, FHKCFP, FRACGP, FHKAM (Family Medicine) Daniel W S Chu, DipOM, FHKCFP, FRACGP, FHKAM (Family Medicine) Correspondence to: Dr Maria K W Leung, Sai Ying Pun General Outpatient Clinic (SYPGOPC), Training Centre of Family Medicine, 134 Queen's Road West, Hong Kong West Cluster, Hong Kong SAR. Reference
|
|||||||||||||||||||||||||||||||||||||||||||||||||||||||||||||||||||||||||||||||||||||||||||||||||||||||||||||||||||||||||||||||||||||||||||||||||||||||||||||||||||||||||||||||||||||||||||||||||||||||||||||||||||||||||||||||||||||||||||||||||||||||||||||||||||||||||||||||||||||||||||||||||||||||||||||||||||||||||||||||||||||||||||||||||||||||||||||||||||||||||||||||||||||||||||||||||||||||||||||||||||||||||||||||||||||||||||||||||||||||||||||||||||||||||||||||||||||||||||||||||||||||||||||||||||||||||||||||||||||||||||||||||||||||||||||||||||||||||||||||||||||||||||||||||||||||||||||||||||||||||||||||||||||||||||||||||||||||||||||||||||||||||||||||||||||||||||||||||||||||||||||||||||||||||||||||||||||||||||||||||||||||||||||||